Overview
> What you can use the Augmentation Impact report for
> Understand the chart and the insights shown
> Different ways to view the insights
What you can use the Augmentation Impact report for
The insights in the Augmentation Impact report can inform your redeployment and internal mobility strategies by showing which workforce segments will benefit from high capacity gain as augmentation technologies are implemented in your organisation, and move them into areas of the organisation with FTE gaps.
Augmentation
Augmentation technology reduces the time it takes for an FTE to complete a task by enhancing their ability in some way. This provides extra time in the work day to complete more tasks, thus improving productivity. This newly available time - or realisable task time - is calculated as capacity gain.
Capacity gain
Capacity gain is calculated as the percentage of realisable task time made available by an FTE who's using an augmenting technology. The percentage capacity gain is also measured by FTEs (hence realisable FTE or rFTE). For example, a team of 100 FTEs with a 10 per cent capacity gain has the equivalent capacity gain of 10 FTEs.
Understand the chart and the insights shown
Key insights
Below the chart, you'll find three key insights from the Augmentation Impact data.
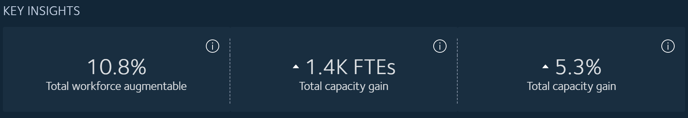
- The total percentage of your FTEs that could be augmented at the time horizon selected in the Years filter.
- The total number of FTEs that could experience capacity gain at the time horizon selected in the Years filter.
- The total percentage capacity gain in FTE time at the time horizon selected in the Years filter.
TIP: Use the Scenario filter to compare capacity gain across different time horizons and different automating technologies.
Interpret the chart
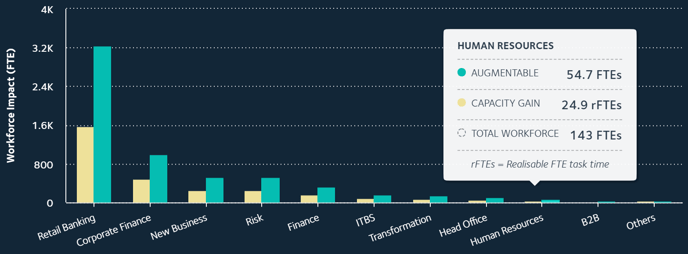
Capacity gain and realisable task time
The bar chart displays, for each organisational unit, the:
- Teal: number or percentage of potential augmentable FTEs
- Yellow: number or percentage of capacity gain by FTE time
Values along the X and Y axes
- X axis - organisational units
- Y axis - toggle between the number or percentage of FTEs
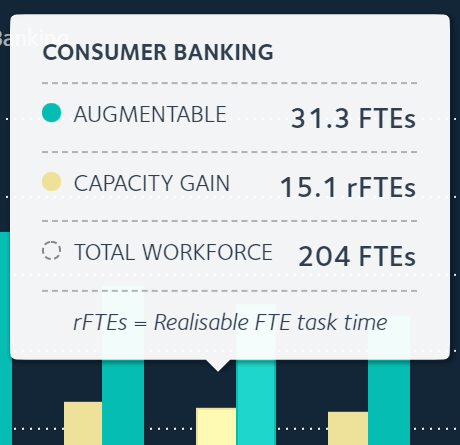 Scroll over the bars for the popup which shows the values for that organisational unit: total number of FTEs, number of augmentable FTEs and potential capacity gain of those augmented FTEs.
View insights within organisational unit hierarchies
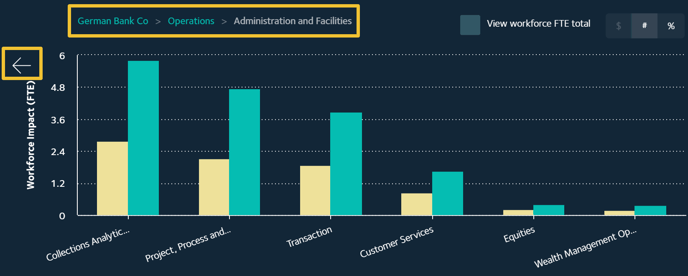
The hierarchical levels within each organisational unit can be viewed by clicking on the coloured bars. The example here shows the units in the third hierarchical level within the Operations organisational unit, then within the Administration and Facilities organisational unit.
To return back to a higher level organisational unit, either click the white arrow at the top left-hand corner of the chart or click on the name of the organisational unit in the breadcrumb navigation above the chart.
Different ways to view the insights
Switch between number and percentage
Use the toggle at the top right-hand corner of the chart to toggle between a view by number and by percentage.
Note: The currency option is disabled for the Augmentation Impact chart as this chart does not show cost savings for augmentation.
 # - The number of FTEs that can realise capacity gain.
% - The percentage of FTEs that can realise capacity gain.
View impacts in comparison to total FTE per organisational unit
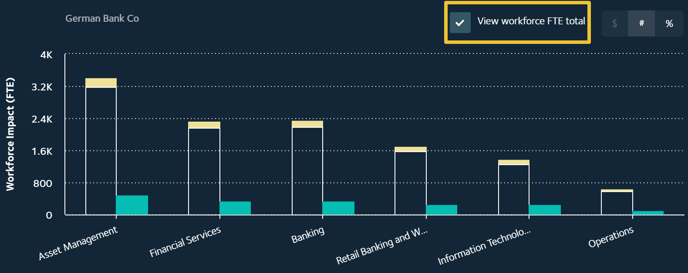
For a visual comparison of the total number of FTEs in each organisational unit and of those, the number that could realise capacity gain once augmented, select the 'View workforce FTE total' checkbox above the chart.
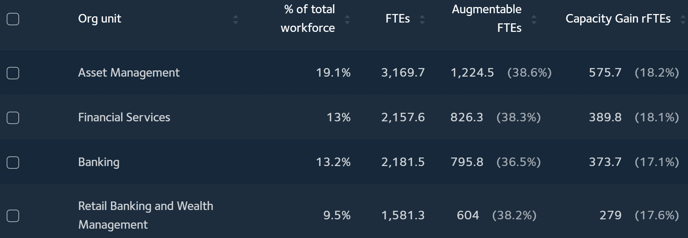
View the data in a table
A table below the chart lists every organisational unit and the FTEs that could be augmented, by total number and percentage. It also displays the capacity gain, by number and percentage, that could be achieved by augmenting that number of FTEs. This provides a second way, along with the bar chart, to view the data and compare changes by time horizon and technology type.
TIP: Download the report insights as a CSV or XLS file to view and analyse the data in one place.
Related articles
Working with the Automation Impact report
How are the automation and augmentation predictions made?
Does Faethm consider the technologies my organisation has already implemented?