Overview
> What you can use the Automation Impact report for
> Understand the chart and the insights shown
> Different ways to view the insights
What you can use the Automation Impact report for
The Automation Impact chart compares your organisation's potential cost savings and changes in workforce size (by number of FTEs) as it's impacted by automation over time. Different time horizons and technologies can be selected from the platform-wide filters for more granular comparisons. These insights can help you prioritise your technology adoption and workforce planning strategies.
Understand the chart and the insights shown
Key insights
Below the chart, you'll find three key insights from the Automation Impact data.

- The total cost savings that can be achieved by automating jobs, therefore reducing total salary costs.
- The total number of FTEs in your workforce with the potential to be automated.
- The total percentage of FTEs in your workforce with the potential to be automated.
TIP: Use the Scenario filter to compare cost savings and automatable workforce numbers across different time horizons and different automating technologies.
Interpret the chart
Current and future state of your workforce and cost savings
The chart displays a grey bar at both the left and right-hand sides. The left-hand bar is the current state - that is, where your organisation is now. The right-hand bar is a potential future state. The figures in these states will change as you refine and filter the data using the platform-wide filters.
Values along the X and Y axes
The values on the X axis are your organisational units, while the values on the Y axis will change as you toggle between a Budget and FTE view of the chart.
Impacts on organisational units
The teal bars in the centre of the chart represent the organisational units. As you mouse over each blue bar, a tooltip will appear with additional details. This information will change as you toggle between viewing the Budget and FTE insights.
TIP: You can reduce the number of organisational units included in the chart by removing them via the Organisational Unit filter. This can be useful when you want to take a look at a comparison of two, or a few, organisational units.
View insights within an organisational unit hierarchy
Depending on the size of the hierarchy in your organisation, it will be possible to view insights at each hierarchical level of the organisational units. To do this, select an organisational unit you want to see more granular insights for and click the teal-coloured bar.
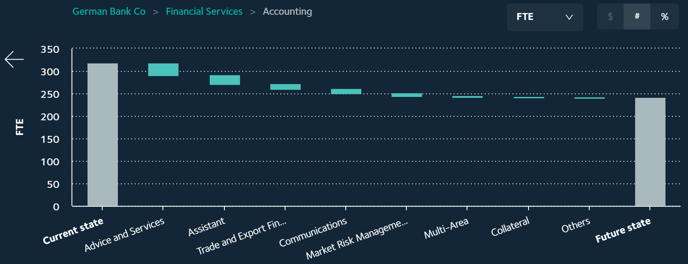
The example here shows the lowest hierarchical level within the Financial Services organisational unit.
There are two ways to click back up through the hierarchy: use the white arrow to the top left-hand corner of the chart or click on the name of the organisational unit in the breadcrumb navigation above the chart.
Different ways to view the insights
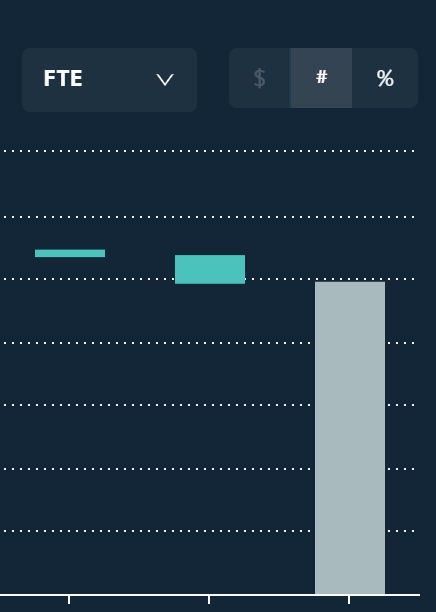
Switch between budget and FTE
Use the toggle at the top right-hand corner of the chart to toggle between a view by budget (cost savings) and a view by FTE (automatable FTEs).
 FTEs
FTEs
The impacts of automation on your workforce are represented by number of FTEs with the potential to be automated.
$ - Budget is not shown in the FTE option.
# - The number of FTEs in your workforce that can be automated.
% - The percentage of FTEs in your workforce that can be automated.
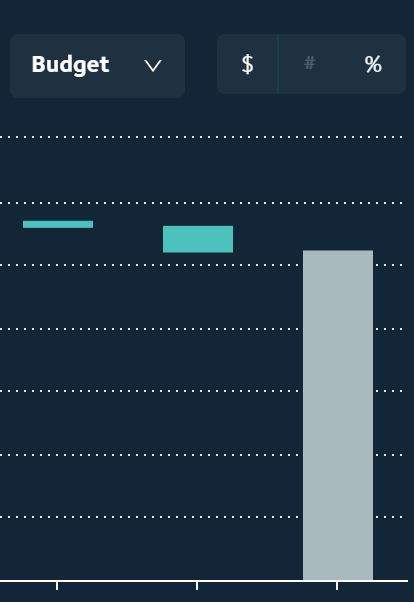 Budget
The impacts of automation on your budget are represented in the currency identified in your original workforce data sets. The figures - both current and future total salary budget - are set at current currency value.
$ - Cost savings
# - Total number of FTEs are not shown in the Budget option.
% - The percentage of FTEs in your workforce that can be automated.
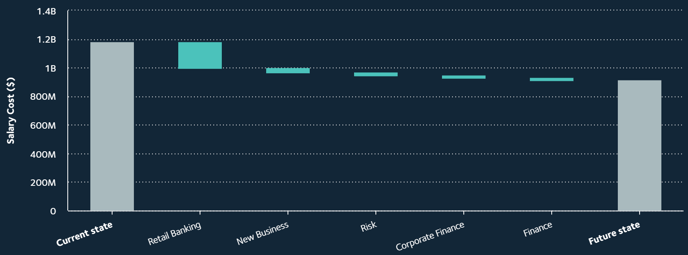
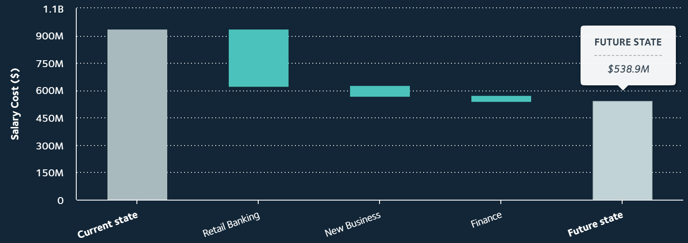
Cost savings: View impacts on budget
-
The grey bar on the left shows the workforce’s total current salary costs before automation.
-
The grey bar on the right shows the possible future salary costs after automation.
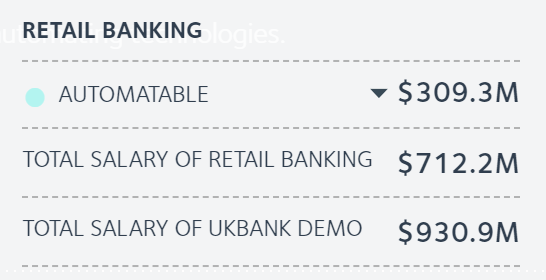 The teal bars in-between show a disaggregated view of potential salary cost savings by each organisational unit. A tooltip appears over each bar that shows the total cost savings possible through automation of that unit, along with the total salary costs of that unit, and the total salary costs of the entire organisation.
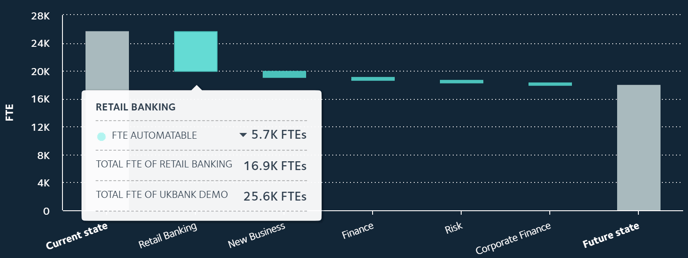
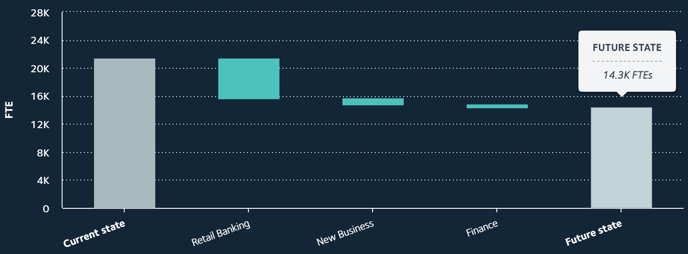
Automatable FTEs: View impacts on FTEs
-
The grey bar on the left shows the total number of FTE’s in the workforce prior to implementing emerging technologies.
-
The grey bar on the right shows the potential total number of FTE’s in the workforce after automation, at the time horizon selected in the Years filter.
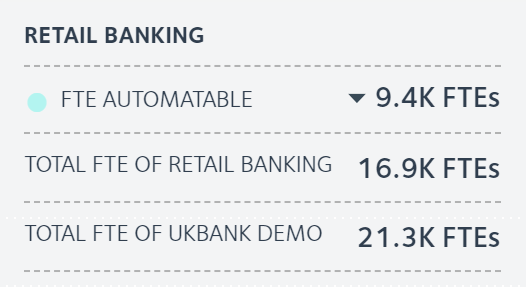 The teal bars in-between show a disaggregated view of potential automatable FTEs. A tooltip appears over each bar that shows the potential automatable FTEs for that organisational unit, along with the total number of FTEs in that unit and the total number of FTEs of the entire organisation.
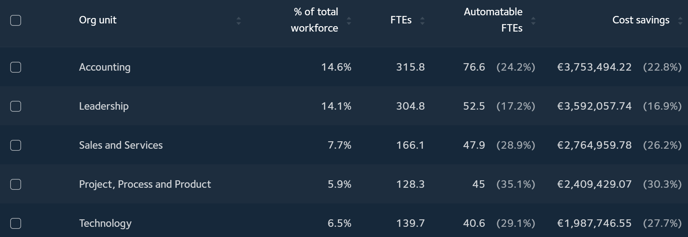
View the data in a table
A table below the chart lists every organisational unit and the FTEs that could be automated, by total number and percentage. It also displays the cost savings, by currency and percentage, that could be achieved by automating that number of FTEs. This provides a second way, along with the bar chart, to view the data and compare changes by time horizon and technology type.
TIP: Download the report insights as a CSV or XLS file to view and analyse the data in one place.
Related articles
Working with the Augmentation Impact report
How are the automation and augmentation predictions made?
Does Faethm consider the technologies my organisation has already implemented?