Skip ahead to:
How do I interpret this chart?
How is Automation Impact on salary costs calculated?
How is Automation Impact on the number of FTEs calculated?
How is Automation Impact represented in currency?
Is the cost of AI implementation considered?
How do I interpret this report?
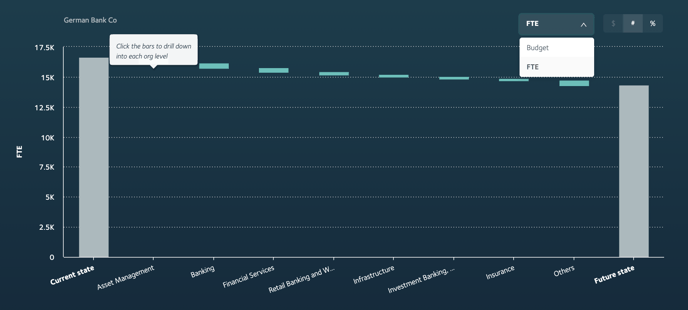
The Automation Impact report surfaces the areas of your workforce with the most opportunity to realise the benefits of automating technologies. This can be viewed by salary cost savings or by number of FTEs.
Use the toggle at the top right-hand corner of the chart to toggle between a view by budget and a view by FTE. The chart displays a grey bar at both the left and right-hand sides of the chart that shows a current and future state, with blue bars in-between to show insights by organisational unit.
When viewing impact on budget:
-
the grey bar on the left ('Current state') shows the workforce’s total current salary costs before implementing emerging technologies
-
the grey bar on the right ('Future state') shows the possible future salary cost after implementation
-
the blue bars between the current and future state show a disaggregated view of potential salary cost savings by organisational unit
When viewing impact on FTEs:
-
the grey bar on the left ('Current state') shows the total number of FTEs in the workforce prior to implementing emerging technologies
- the grey bar on the right ('Future state') shows the potential total number of FTEs in the workforce after implementation
- the blue bars between the current and future state show a disaggregated view of potential FTEs impacted by organisational unit
Below the chart, key insights show:

-
Total salary cost - The total salary costs that could be reduced by automating jobs, if the selected technology types (from the global 'Technologies' filter) are implemented at the selected year (from the global 'Years' filter).
-
Total workforce automatable by number – The number of FTEs (in the workforce selection) that could be automated if the selected technology types (from the global 'Technologies' filter) are implemented at the selected year (from the global 'Years' filter).
-
Total workforce automatable by percentage - The percentage of FTEs in the workforce selection that could be automated if the selected technology types (from the global 'Technologies' filter) are implemented at the selected year (from the global 'Years' filter).
How is Automation Impact on salary costs calculated?
All tasks in a job are assigned either an automating or augmenting technology. Automatable tasks represent a cost take-out opportunity, measured as the reduction of an employee’s salary by reducing the time spent on an automated task. Because each technology has an adoption rate, the likelihood of a company adopting a technology at a point in time is also considered.
The calculation is, therefore, the total salary spent on a task being automated multiplied by the likelihood of adopting the automating technology (FTEs x salary x automated task-time). As an example, total salary cost savings for an accounting department with ten accountant FTEs with a total salary of $1M and several automatable tasks equalling 20% total time reduction at year 5 equals $200K ($1M x 20%). This impact is then quantified at an organisational unit level and across the workforce to give the total Automation Impact on salary costs.
How is Automation Impact on the number of FTEs calculated?
All tasks in a job are assigned either an automating or augmenting technology. Automatable tasks represent a cost take-out opportunity, measured as the reduction of an employee’s time by reducing the time spent on an automated task. Because each technology has an adoption rate, the likelihood of a company adopting technology at a point in time is also considered.
The calculation is, therefore, the total time spent on a task being automated multiplied by the likelihood of adopting the automating technology (FTEs x automated task-time). As an example, total FTE savings for an accounting department with 100 accountant FTEs with several automatable tasks equalling 20% total time reduction at year 5 equals 20 FTE (100 x 20%). This impact is then quantified at an organisational unit level and across the workforce to give the total Automation Impact on salary costs.
How is Automation Impact represented in currency?
The Automation Impact on your workforce by salary costs is represented in the preferred currency provided in the data onboarding process. These figures (including current and future total salary budget) are based on and displayed at present value. No economic inflation or growth adjustments have been made.
Is the cost of AI implementation considered?
Faethm does not currently model the cost to conduct strategy and implementation work to implement AI technologies.
Is the cost of redeployment considered?
Faethm does not currently model the cost to re-deploy people (e.g. via strategic human capital and operating model transformation projects).
How can these insights be applied?
The Automation Impact chart shows the size of future cost savings and future workforce size by FTE via technology adoption across organisational units, which would assist to prioritise organisational units for technology and people transformation.
The global filters can be used to scenario model the merging technologies that could be deployed per organisational unit and when over the next 15 years. These insights can be applied to inform, validate, or challenge current workforce technology strategy and roadmaps, and to prioritise organisational units for future workforce strategy, reskilling, and redeployment.