Overview
> What you can use the Age Impact report for
> Understand the chart and the insights shown
What you can use the Age Impact report for
The Age Impact is a filter that provides deeper insight into how and to what extent each age bracket in your workforce is likely to be impacted by technology. There are six age brackets:
- 15 - 24
- 25 - 34
- 35 - 44
- 45 - 54
- 55 - 64
- 65 - 74
These insights can be used to inform strategic workforce planning, particularly your internal mobility plans and L&D strategies.
Understand the chart and the insights shown
Key insights
Below the sunburst chart, you'll find three key insights that are gleaned from the Age Impact workforce data.
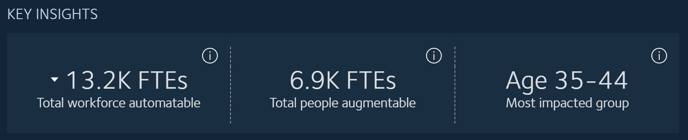
The key insights provide a summary:
- The number of FTEs in the workforce selection that could be automated by the filtered technology types at the selected year.
- The number of FTEs in the workforce selection that could be augmented by the filtered technology types at the selected year.
- The most impacted age group in the workforce selection considering both automation and augmentation by the filtered technology types and year.
TIP: To compare the impacts on each age bracket over time, use the Scenario filter to select specific technology types and years.
What the chart reveals
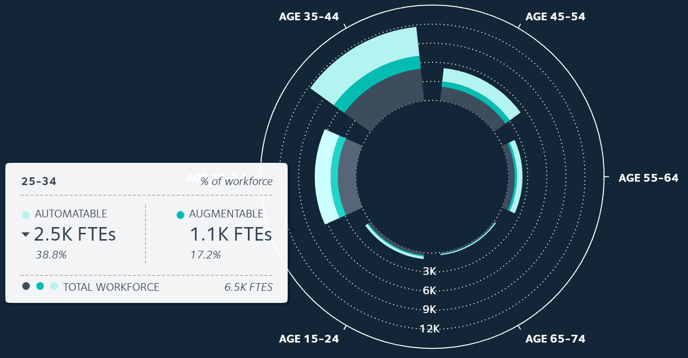
The sunburst chart uses colours to convey the insights:
-
Outer light blue - the proportion of aggregated FTEs that will be automated
-
Middle blue - the proportion of aggregated FTEs that will be augmented
-
Grey - unimpacted workforce
The sum of the light blue, blue and grey areas provides the total number of FTEs in each age group.
As you mouse over each age age bracket, a popup appears with additional details that include:
- the number and percentage of the workforce, by FTE, that's automatable and augmentable
- total workforce number of that age bracket
A table below the chart lists every age bracket, along with numbers and percentages of FTEs that will be unimpacted and impacted by augmenting and automating technologies. This provides a second way, along with the sunburst chart, to view the data and compare changes by time horizon and technology type.
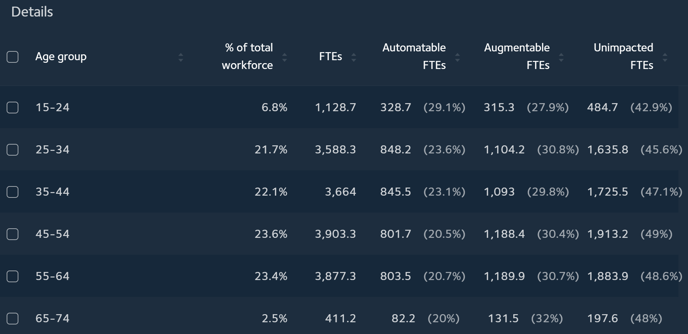
TIP: Download the report insights as a CSV or XLS file to view and analyse the data in one place.
Related articles
Working with the Job Impact report
Working with the Automation Impact report
Working with the Augmentation Impact report