Overview
> What you can use the Technology Portfolio for
> Understand the Technology Portfolio insights
> Different ways to view the insights
What you can use the Technology Portfolio for
The Technology Portfolio provides an overview of the types of technologies that could deliver the most cost savings and capacity gain when adopted in your organisation.
Understand the Technology Timeline insights
Key insights
Below the chart, you'll find three key insights from the Jobs Added data.

The key insights provide a summary:
- The total salary costs that could be reduced as a result of automation, at the timeframe selected in the Years filter.
- The percentage of capacity gain that FTEs will experience as their tasks are augmented, at the timeframe selected in the Years filter.
- The number of FTEs that will need to be added to the workforce to implement and manage emerging technologies. This insight can be refined by using the Scenario filter to select a specific technology type, or types, and the time horizon.
What the chart reveals
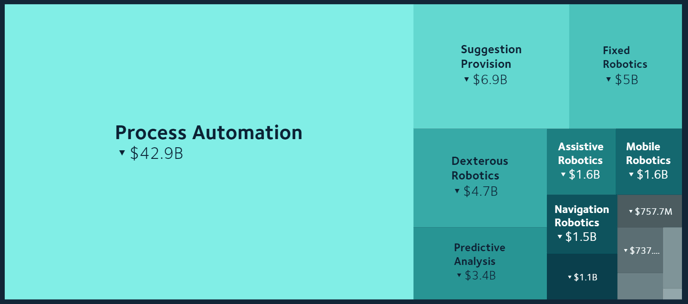
The lighter the colour and larger the proportion of the square on the chart, the greater the potential cost savings to your organisation from that that particular technology type.
The tooltip that appears as you mouse over each technology type also shows the percentage of overall automation opportunity for your organisation from that technology.
Automating technologies
-
The treemap chart displays the total cost savings due to a reduction in salaries, caused by each automating technology over the selected time horizon.
- Colour is used to differentiate each technology type. The technology that presents the greatest cost savings is the largest shape in the treemap and has the lightest colour.
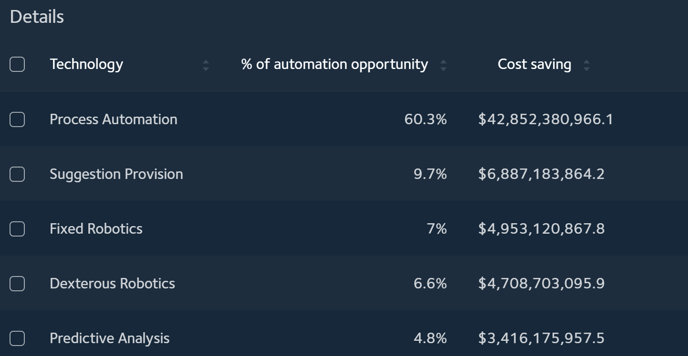
- A table below the chart lists the exact currency value of cost savings per year (from one to five years into the future), per technology type, along with the opportunity, by percentage, that the automating technology offers for cost savings by salary reduction.
Augmenting technologies
-
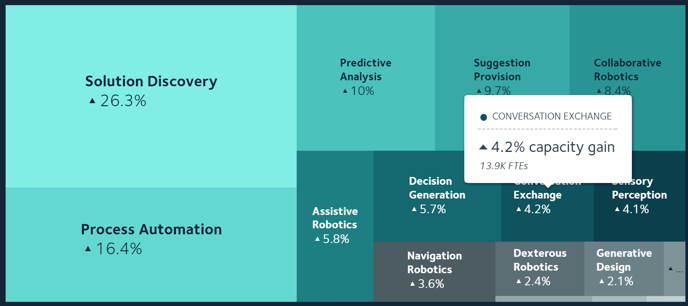
The chart displays the percentage capacity gain for each augmenting technology at the selected time horizon.
- Colour is used to differentiate each technology type. The technology that presents the greatest capacity gain is the largest shape in the treemap and has the lightest colour.
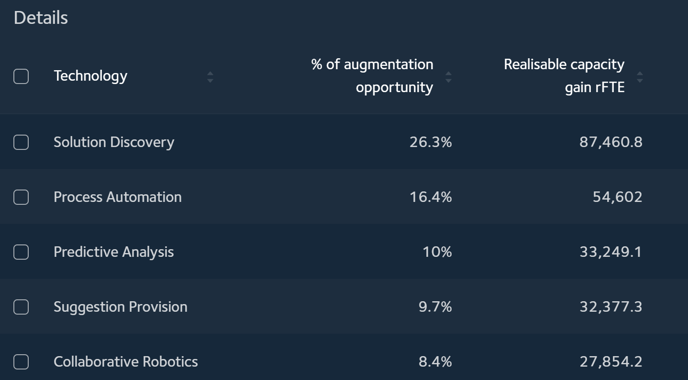
- A table below the chart shows the opportunity, by percentage, that the technology offers for augmentation of jobs in your workforce and the total number of FTEs that could realise that capacity gain.
Learn more about the technologies
 As you mouse over each technology on the chart, a tooltip will pop up with key insights about that technology and the opportunities it can deliver to your organisation. To learn more, click the technology name.
TIP: For a full view of every technology at each year in your selected timeframe, download the chart in a CSV or XLS file.

The overlay provides additional information about the technology includes a definition and description, technology examples and a few examples of how the technology is in use around the world.
Different ways to view the insights
The chart can be filtered to refine future scenarios of automation and augmentation opportunities and impacts.
Use the platform filters
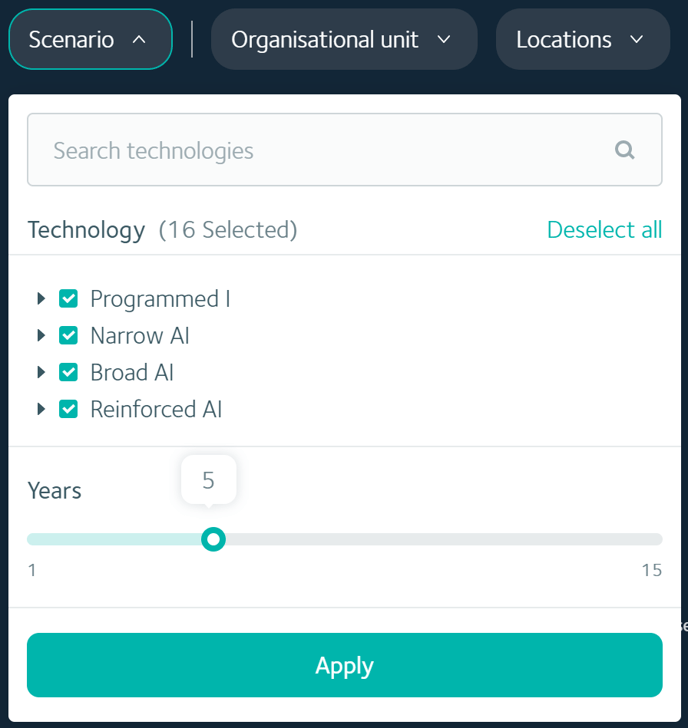 Using the scenario filters to compare impacts across time horizons and by different technology types is the most common refinement.
For a more granular view of specific segments of your workforce by organisational unit, location, demographics or other filter such as job category, you can continue refining the impact insights using the platform-wide filters.
Switch between viewing augmentation and automation impacts

To switch between views of automation and augmentation impacts, use the dropdown at the top right-hand corner of the chart.
TIP: To evaluate total values across all technologies, use the Download option and download the data in an XLS or CSV file.
Related articles
Working with the Job Corridor report