Overview
> What you can use the Gender Impact report for
> Understand the chart and the insights shown
What you can use the Gender Impact report for
The Gender Impact is a filter that provides deeper insight into how and to what extent each gender is likely to be impacted by technology.
It's useful to focus in on the gender mix within different organisational units and locations to understand how the job transition requirements of each gender are unique and be used to inform your workforce planning, transformation initiatives and DEI strategy.
Understand the chart and the insights shown
Key insights
Below the sunburst chart, you'll find three key insights that are gleaned from the Gender Impact workforce data.
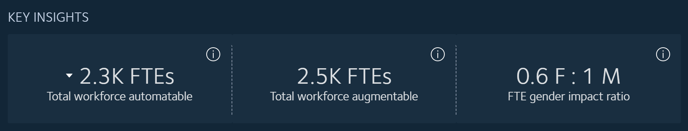
The key insights provide a summary:
- The number of FTEs in the workforce selection that could be automated, at the time horizon selected in the Years filter.
- The number of FTEs in the workforce selection that could be augmented, at the time horizon selected in the Years filter.
- The ratio of impacted female FTE compared to male FTE, at the time horizon selected in the Years filter.
TIP: To compare the impacts on each genders over time and by different technologies, use the Scenario filter to refine the insights by technology types and years, from one to 15 years into the future.
What the chart reveals
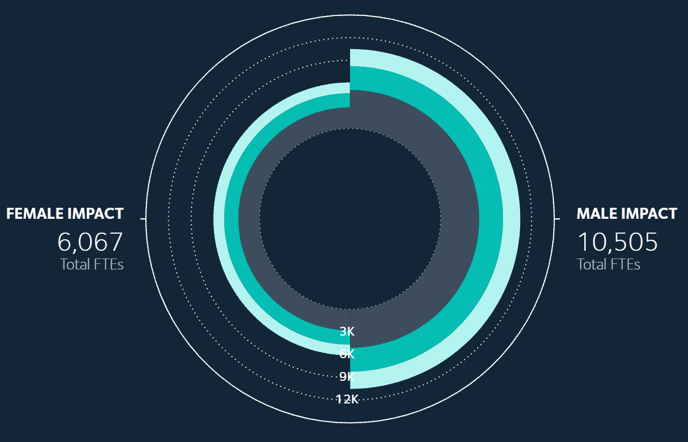
The sunburst chart uses colours to convey the insights:
- Outer light teal - the proportion of aggregated FTEs that will be automated
- Middle darker teal - the proportion of aggregated FTEs that will be augmented
- Grey - unimpacted FTEs
The sum of the light blue, blue and grey areas is the total number of FTEs.
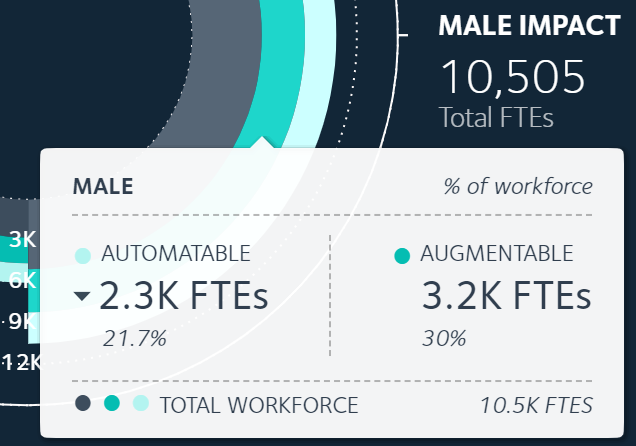 As you mouse over each gender, a popup appears with additional details that include:
- the number and percentage of the workforce, by FTE, that's automatable and augmentable
- total workforce number, by FTE, of that gender
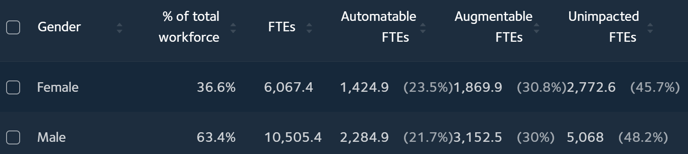
A table below the chart lists each gender, along with the numbers and percentages of FTEs that will be unimpacted and impacted by augmenting and automating technologies. This provides a second way, along with the sunburst chart, to view the data and compare changes by time horizon and technology type.
TIP: Download the report insights as a CSV or XLS file to view and analyse the data in one place.
Related articles
Working with the Job Impact report
Working with the Automation Impact report
Working with the Augmentation Impact report