It is powered by four APIs within the Skill Trends by Industry API Group:
-
Trending Skills by Industry API
-
Emerging Skills by Industry API
-
Declining Skills by Industry API
-
Historical Skill Trends by Industry API
Together, these APIs help you compare skill demand patterns that are:
-
Rapidly increasing in relevance
-
Newly emerging and gaining traction
-
Declining in prominence
-
Historically evolving over time
This makes the chart ideal for workforce planning, training strategy, industry-aligned talent development, and early signal detection.
What this chart shows
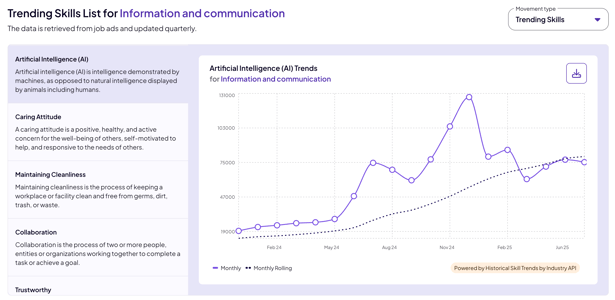
Each line on the chart represents how often a specific skill appears in job ads within the chosen industry, using a rolling value that smooths fluctuations and highlights underlying trends.
- Y-axis: Job Ad Mentions
The y-axis visualises the number of job ad mentions, allowing you to compare skills consistently within the industry. These values reflect aggregated, normalised counts (e.g., mentions out of a defined job-posting volume). - X-axis: Time
The x-axis displays a monthly timeline.
In the screenshot, the trend spans January to June, updated quarterly, but longer timelines (12–24 months) are common depending on the data window.
Example
If “Artificial Intelligence (AI)” is selected as a skill:
-
A rising line indicates increasing adoption of AI skills in that industry.
-
A falling line signals softening demand or a shift in hiring priorities.
This makes the chart a straightforward way to identify which skills are accelerating, stabilising, or declining.
Why it matters
This chart gives you a real-time, evidence-based view of what the labour market needs in your industry.
- Validate whether a trend is real or temporary
Is the rise in “Cloud Security” sustained over time, or was it just a brief spike driven by one quarter’s hiring activity? - Plan workforce, L&D, and recruitment strategies proactively
Spot emerging skills early—before they become widely adopted and talent becomes scarce. - Identify declining skills
Skills with downward trends may indicate: -
-
Outdated technologies
-
Shifts in industry tools
-
Reduced training priority
-
Opportunities to phase out legacy systems
-
- Compare multiple skills across time
Overlaying skills helps you:
-
-
Prioritise skills development
-
Benchmark talent maturity
-
Understand which capabilities will define the industry’s future
-
How to read the values
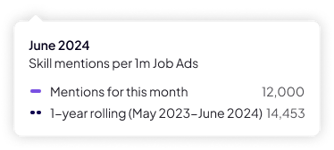
Your Skill Trends chart includes two types of values, depending on where you look:
- Tooltip (on hover)
Shows a 1-year rolling average of skill mentions. This smooths out month-to-month noise and helps you see the true underlying direction of the trend. - Chart legend / series label
Reflects a monthly rolling value, which represents that individual month’s data point (still smoothed to reduce noise).
What does “rolling” mean?
A rolling value is calculated over a moving time window.
- 1-year rolling average
Each plotted point shows the average number of mentions across the 12 months leading up to that month. This highlights consistent, long-term patterns. - Monthly rolling
Shows only that month’s demand, but with light smoothing to avoid random noise or one-off jumps.
Why both views are useful
| Metric | What it tells you | Best for |
|---|---|---|
| 1-year rolling avg (tooltip) | A stable, long-term view of demand | Spotting sustained increases or declines |
| Monthly rolling (legend) | Captures recent spikes or dips | Reacting to short-term market signals |
By comparing them, you can tell whether a skill:
-
Shows a short-term spike that might fade
-
Has a steady growth trajectory signalling lasting importance
-
Is experiencing a consistent decline that may influence training priorities
This combined view is ideal for strategic decision-making across workforce planning, industry-aligned L&D, and talent acquisition.