The Occupations tab on Workforce Snapshot gives you a detailed understanding of how your workforce is structured once your job titles have been mapped to Pearson’s ontology. This view shows how occupations, job families, and categories appear across your organization, helping you identify patterns, concentrations, and the true structure of your workforce.
This article explains every component of the Occupations tab and how to use it.
Your Pre-classified Data
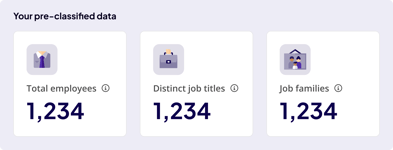
This section shows the raw counts from your uploaded workforce dataset before ontology mapping is applied.
You’ll see three key metrics:
-
Total employees – The total number of employees in your dataset.
-
Distinct job titles – How many unique job titles appear in your data.
-
Job families – The number of job families present in your pre-classified data (if provided).
These values help you understand the variety and complexity of your raw workforce data before classification.
Your Classified Occupations
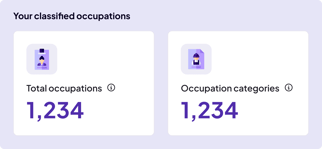
After mapping is complete, this section shows the number of occupations and occupation categories generated from your data.
It includes:
-
Total occupations – The total number of standardized occupation titles assigned to your workforce.
-
Occupation categories – High-level occupation groupings based on Pearson’s ontology (e.g., Marketing & Design, Business Operations, Engineering).
This gives you a baseline view of how your workforce aligns to the broader labor market structure.
Top Occupations Across the Organization
The table lists the most common occupations (occupations with highest headcounts) in your workforce, along with:
-
Occupation category – The high-level category that each occupation belongs to.
-
Classified occupation title – The standardized ontology occupation that your internal job titles were mapped to.
-
Employee count – The number of employees mapped to each occupation.
Where relevant, the table also shows:
-
Internally known as – All internal job titles that were mapped into this occupation (e.g., “User Experience Designer,” “Creative & UX Designer,” “Interaction Designer”).
This helps you see how your varied job titles consolidate into consistent occupation definitions and which roles appear most frequently across your workforce.
Occupation Category Distribution
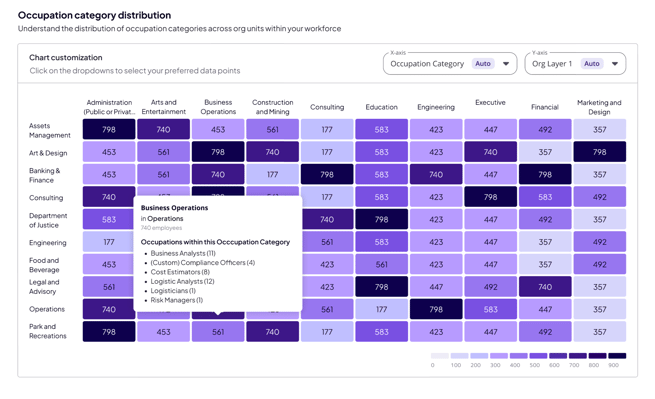
Chart Customization
At the top of the chart, you can filter results using fields such as:
-
Org Layer – View occupations by organization unit or hierarchy level.
-
Occupation category – Drill into a specific occupation group.
-
Additional filters (such as job family or country) may also appear depending on your dataset.
These filters allow you to narrow the view and analyze how occupations differ across divisions, regions, or layers of your organization.
About the Chart
Underneath that, there's a heatmap chart that shows how occupation categories are distributed across your organization’s units.
It allows you to:
-
Compare the size of each occupation category across departments or org layers
-
Identify concentration areas (e.g., where Business Operations roles or Marketing & Design roles cluster)
-
Spot anomalies or unexpected distributions
-
Quickly interpret workforce composition through color intensity and employee counts
The chart includes dropdown selectors where you can customize:
-
X-axis (e.g., Org Layer)
-
Y-axis (e.g., Occupation Category)
This lets you change the view depending on what you want to analyze.
Chart Interaction
When you select a specific occupation category in the distribution chart, you’ll see:
-
A list of all occupations within that category
-
The number of employees mapped to each occupation
-
An overview of how those occupations appear across your organization
This drill-down helps you understand the granularity of work happening within a specific domain or function.
What You Can Do With the Occupations View
The Occupations tab helps you:
-
Understand your workforce structure
See how your job titles consolidate into standardized occupations and categories. -
Compare roles across departments
Identify where occupations are concentrated and how work is distributed. -
Identify internal inconsistencies
Spot where multiple job titles map to the same occupation, suggesting opportunities for title standardization. -
Build a clearer baseline for workforce planning
Use occupational structure as the foundation for skills analysis, capability mapping, and future-state workforce design.