Understanding how to read this data can help you uncover longer-term market shifts, cyclical hiring patterns, or surges in relevance driven by industry events or technology adoption.
What does the chart show?
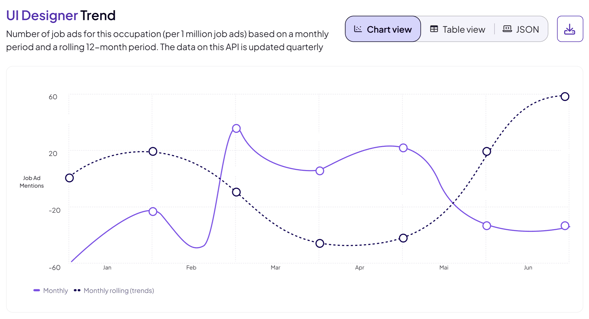
This chart tracks monthly job ad mentions for a selected occupation over time. Each data point represents the number of job ads per 1 million ads that mention that occupation.
This normalization makes it easy to compare trends across different roles, regardless of overall ad volume fluctuations.
How to read the values
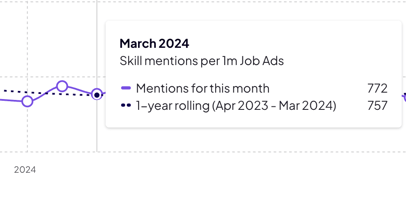
When reading the chart, you’ll notice two types of values based on where you’re looking:
-
Tooltip (on hover): shows a 1-year rolling average of job ad mentions.
-
Chart legend: reflects a monthly rolling value — typically representing that individual month's data.
What does “rolling” mean?
A rolling value calculates the average (or count) over a moving time window. As time progresses, the window shifts forward — offering a smoothed, ongoing view.
-
A 1-year rolling average means each point shows the average mentions from the 12 months leading up to that month.
-
A monthly rolling view shows only that month’s mentions, but may still be smoothed to reduce noise.
Why both are useful
| Metric | What it tells you | Best for |
|---|---|---|
| 1-year rolling avg (tooltip) | Smoothed view of long-term trend | Spotting sustained increases or declines |
| Monthly rolling (chart legend) | Recent spikes or dips — more volatile and sensitive | Reacting to short-term market signals |
By comparing them, you can distinguish between:
-
A sudden spike that may be temporary
-
A steady upward trend that reflects genuine long-term demand
This combination gives a more complete view of hiring dynamics — perfect for informed decision-making across workforce and hiring initiatives.
Why it matters
This chart is especially useful for identifying:
-
Emerging or declining occupations
-
Post-pandemic recovery or demand shifts
-
Sustained demand for futureproofing your workforce
It helps workforce planners and people strategists separate short-term hype from lasting relevance.