This includes percentage impacts, estimated hours saved, and total technology impact across several years — often up to 15 years into the future, depending on the analysis period available.
This article explains how to read the API outputs, how to interpret impacts in context, and why technology impacts generally increase year-on-year based on the Technology Adoption Curve.
Key Definitions
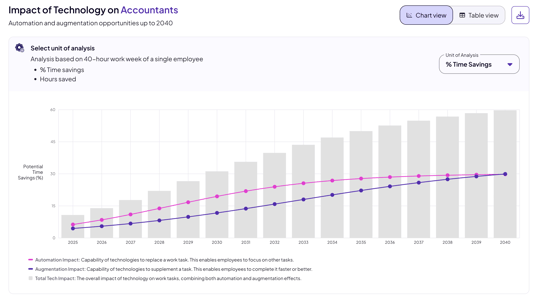
- Automation Impact - The % of work tasks that could be replaced by technology.
Automation allows employees to redirect time to other responsibilities. - Augmentation Impact - The % of work tasks that could be supplemented by technology.
Augmentation speeds up task completion or improves task quality. - Total Tech Impact - The combined effect of automation and augmentation — representing the overall potential impact of technology on time spent on tasks.
Understanding the Outputs
The API typically returns something like:
| Year | Automation (% / Hours) | Augmentation (% / Hours) | Total Tech Impact (% / Hours) |
|---|---|---|---|
| 2025 | 11% / 18.2h | 12% / 12.3h | 23% / 30.5h |
| 2026 | 11% / 18.2h | 12% / 12.3h | 23% / 30.5h |
| … | … | … | … |
What this means:
1. Year-over-Year Trend - Each row represents predicted technology effects in that year.
Use this to understand how quickly an occupation is expected to change.
2. Percentage vs. Hours Saved - Switching to Hours Saved (shown on page 1 of the “Hours Saved” design) gives a more intuitive sense of impact:
-
% Time = proportion of task time affected
-
Hours Saved = estimated hours an employee could save annually, based on a 40-hour week
3. Total Tech Impact
This is the primary indicator for strategic decisions, combining both automation and augmentation.
It helps you answer:
-
How much of this occupation can be automated?
-
How much can be accelerated or enhanced by technology?
-
How does this impact change across time?
How to Use This Data
- Workforce Planning
See when an occupation begins experiencing major automation pressure, helping you prepare for workforce shifts. - Succession & Role Evolution
Identify when tasks become fully or partially automatable and plan reskilling or role redesign. - Learning & Development
Use augmentation indicators to determine where technology-enabled upskilling will deliver the most benefit. - Technology Roadmapping
Align your company’s technology adoption strategy with predicted occupation-level impacts.
Why Technology Impact Usually Increases Every Year
Technology impacts rarely go backward — and when they do appear to flatten, it’s temporary.
This API’s year-by-year values follow the same modelling principles described in the Technology Adoption Curve article.
How it works:
-
Each technology (e.g., NLP, AI assistants, robotics, etc.) follows an S-curve adoption pattern — slow at first, then rapid growth, then saturation.
-
Multiple technologies influence each occupation. Over time:
-
More technologies reach maturity
-
Adoption rates compound
-
More tasks become suitable for augmentation or automation
-
This results in a consistent upward trend in automation/augmentation percentages across years.
Implication for interpretation
-
If Technology Impact is 10% in 2025 and 18% in 2030 → this reflects the natural acceleration of adoption.
-
A flat line does not mean technology is stagnating; it often means:
-
The primary technologies for that occupation are already mature
-
Remaining tasks have lower automation potential
-
New technologies aren’t yet contributing (but will in future updates)
-
This is why Total Tech Impact will always rise or stay level, but never drop.
Example Interpretation

Let’s use the Accountant example:
- Automation: 16% in 2026
- 16% of task time could be fully automated.
- Time freed up for higher-value work.
- Augmentation: 36% in 2026
- Technologies enhance or speed up tasks, supporting efficiency improvements.
- Total Tech Impact: 52%
- Over half of all tasks are expected to be affected by technology.
This indicates a highly augmentable occupation where productivity tools (AI, analytics, workflow automation) improve work before full automation becomes dominant.
Tips for Using This API Effectively
-
Compare multiple occupations to see which ones undergo faster disruption.
-
Start with Hours Saved for operational planning (FTE reduction, workload distribution).
-
Use % Time when you want to understand proportional task impact.