The Job Profiles report is highly comprehensive. It includes all jobs in your organisation's workforce, as well as every other job in Faethm's extensive Occupation Ontology - more than 5,000 unique occupations.
The report chart displays the total number of FTEs in each job, and of each job, the total number of FTEs likely to be automated. A more granular profile - the job profile - can be viewed of each job. Each job profile presents:
- all tasks performed in the job
- the time spent on each task within a 40-hour working week
- the technology type that's likely to either augment or automate the task
Overview
> What you can use the Job Profile insights for
> Understand the Job Profile insights
> Customise what you see on the chart
> Analyse insights for an individual job
What you can use the Job Profiles insights for
The list of tasks associated with each job is a globally recognised standard, making the Job Profiles report ideal for:
- developing position descriptions for jobs you'd like to add to your workforce
- identifying whether any key tasks are missing from current workforce jobs in order to update responsibilities and upskill where needed
Each individual job profile displays the time spent on each task within a 40-hour working week and the technology type that's likely to either augment or automate the task. Therefore this report can also be used to:
- understand which tasks are more likely to be automated, by time spent
- identify the most time-consuming tasks in your workforce and use the platform filters to understand where your organisation is most impacted - such as job stream, location, gender and age demographics, and organisational unit
- inform your technology adoption strategy, by identifying which technologies present the strongest opportunities to automate tasks and free your people up to take on higher-value tasks
Understand the Job Profiles insights
Breadth of data included in the chart

.png?width=688&name=Faethm-Platform%20(52).png)
-
At the top of the cart, just below the keyword search form, you’ll see the full breadth of data that’s included in the chart:
-
all jobs
-
total of internal jobs
-
total of external jobs
-
-
When you search for a specific job, or use any of the chart filters, you’ll see these totals change accordingly. This is useful when you are looking for a specific job within your organisation and would like to see how many of those roles exist in your organisation.
The insights in the chart
-
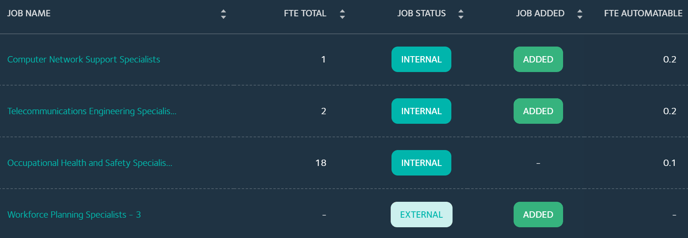
Job Name: This is the list of job titles.
-
FTE Total: The total number of FTE’s in that job. You’ll see that only jobs with the Internal label display an FTE total. Jobs with an External label have no data shown in this column. That’s because we’re using your workforce data in this chart, so we can only populate this field with the data associated to your organisation’s jobs.
-
Job Status: An Internal job (a job in your organisation) or an External job (a job not in your organisation). The External jobs are all jobs included in Faethm’s Occupation Ontology. You can choose to view both Internal and External jobs in this column by selecting the All button at the top right hand corner of the chart.
-
Job Added: The purple label, Job Added, appears in this column to indicate that this is a job that’s also included in the platform’s Jobs Added chart. The Jobs Added chart displays all jobs that Faethm considers to be essential to the future of work. The Jobs Added chart is useful for identifying jobs with future growth potential in order to plan internal mobility options for your workforce.
-
FTE Automatable: The total number of FTE’s that are likely to be automated within the timeframe selected in the platform’s Years filter. Just as for the FTE Total column, only data associated with your workforce data is displayed, so you’ll only see data for Internal jobs.
Customise what you see on the chart
The Job Profiles chart has a few tools that enable you to customise your view of the data.
Select and deselect columns, and rearrange the columns
.png?width=688&name=Faethm-Platform%20(42).png)
- At the top right hand side of the chart, select three green dots.
-
To remove a column, click in the checkbox to remove the tick.
-
To add a column, click in an empty checkbox to add the tick.
-
To add or remove all columns at the same time, click the Select all / Deselect all link.
-
To change the order of the columns, drag each column by clicking and holding the three-line icon.
Search jobs and filter results by All and Internal
Across the top of the chart is a keyword search form and two buttons labelled Internal and All.
.png?width=688&name=Faethm-Platform%20(53).png)
-
To view a list of only the jobs in your organisation, select the Internal button.
-
To view every job possible, which is all jobs in your organisation plus all other jobs in Faethm’s Occupation Ontology, select the All button.
-
Search for any job by job title, or part of the job title, in the keyword search field and press enter to see the results. You can use the Internal or All buttons to further refine or broaden your search results.
.png?width=688&name=Faethm-Platform%20(45).png)
Analyse insights for an individual job
View a job profile
You can access an individual job profile by clicking the job title of any job listed on the main Job Profiles page. The purpose of the individual job profile report is to give you a broad summary of technology impacts on tasks, and the skills and potential job pathways for each job. These insights will provide you with an ideal foundation to your analysis of insights throughout the other reports on the platform.
.png?width=688&name=Faethm-Platform%20(48).png)
-
On the main Job Profiles chart, click on a job title to access the individual job profile.
- This will take you to the individual job profile where you can view more insights about that specific job, including:
- An overview of the automatable and augmentable FTEs
- A list of all tasks performed in that job and the technology type that’s predicted to have the greatest impact on that task
- A list of the top twenty skills
- A list of the top job pathways within a time horizon of five years
An overview: The job profile key insights
.png?width=688&name=Faethm-Platform%20(37).png)
-
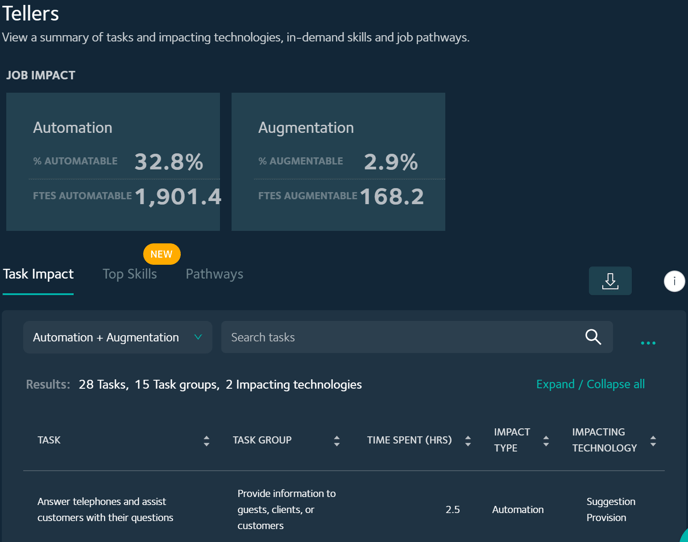
At the top of the individual job profile page, you’ll see key insights highlighted. These insights show you the total automation and augmentation impacts on that job by:
-
percentage FTE automatable and augmentable within the timeframe you’ve set in the Years filter
-
total number of FTE automatable and augmentable within the timeframe you’ve set in the Years filter
-
The impacting technologies
1. Task and task group
.png?width=688&name=Faethm-Platform%20(40).png)
-
Every task performed in this job is listed alongside the task group.
-
Both the list of tasks and the task groups can be sorted alphabetically using the toggle at the top of the chart columns.
2. Time spent on task
.png?width=688&name=Faethm-Platform%20(58).png)
-
The time spent per task is by total hours spent on that task within a 40-hour week. Therefore, the sum total of all time spent on tasks in this list is 40 hours.
-
The time spent on each task can be sorted from least to most time spent.
3. Impact type and impacting technology
.png?width=688&name=Faethm-Platform%20(59).png)
-
The Impact Type column shows whether the impact is from an automating or an augmenting technology, and the next column, Impacting Technology, lists the technology type.
-
These two columns can be sorted alphabetically, using the toggle at the top of the chart columns.
4. Filter the technology types
.png?width=688&name=Faethm-Platform%20(50).png)
-
The job profile chart will load with both augmentation and automation technologies.
-
To view solely automation or augmentation technologies, use the dropdown menu at the top left-hand side of the chart to filter.
-
You can also use the sort icon next to the Impact Type column title, to sort Automation and Augmentation alphabetically.
-
When you’re viewing the insights on just one technology type, you might like to sort the chart by the Impacting Technology.
The top skills
To date, we’ve analysed nearly four million Australian job ads posted on job search websites to identify and extract skills. Currently, all skills extracted from online job ads appear only in this chart on the platform.
The top skills are a measure of:
- Frequency: the number of job ads in which the skill has been found, which can be correlated to how in-demand the skill is for that job
- Specialisation: whether or not the skill is a specialist skill for that job; skills that are commonly occurring for all jobs aren't considered specialist.
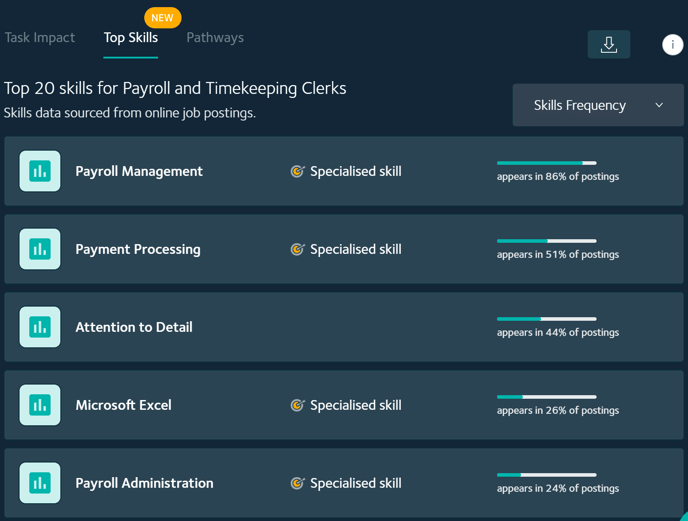
In the columns alongside each skill, you'll see:
- whether or not it's a specialised skill
- the percentage of job postings, for this job, in which the skill was found
Sort the skills
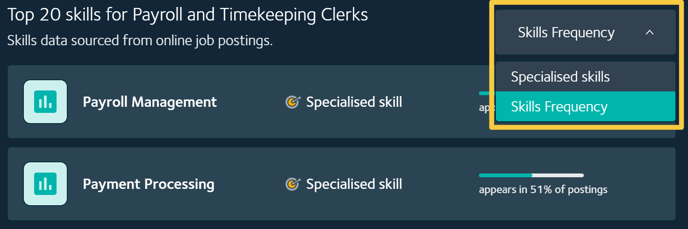
Using the dropdown menu at the top right-hand corner of the table, the skills can be sorted by:
- How frequently they've appeared in job postings
- Whether or not they're specialised for that job
The top five job pathways
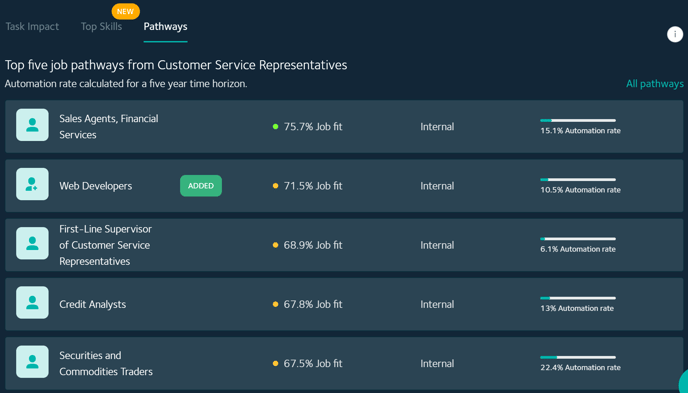
-
To view the top five job pathways for a job, select the Pathways tab at the top of the chart.
-
This will load the five target jobs that have the best job fit for a transition, along with insights to help you understand the viability of that transition:
-
Job title.
-
Whether or not the job is an Added Job, which is shown with an ‘added’ label.
-
The percentage job fit.
-
Confirmation that the job is internal. Only internal jobs will be shown in this job pathways list. To see all job transitions, which also include external jobs, select the All Pathways link at the top of this list.
-
The percentage automation rate. This is the estimated automation rate within a five-year timeframe from now.
-
- These five pathways will only ever include target jobs that are already in your organisation.
-
To view more job pathways, including pathways to both external and internal jobs, select the All Pathways link at the top right-hand corner of the table. This will take you to the Job Corridor chart where you’ll be able to explore every possible job pathway.
Related articles